
briefpeak
Your store's numbers, explained in plain English
After milestone #2, I had solid validation — conversations with store owners who independently confirmed that dashboards don't work for them and they wanted something simpler. I had momentum building on Reddit and in the Shopify Community. Things were moving.
Then I left for a 6-week vacation and business trip. I made a deliberate call: keep building, stop distributing. No community posts, no outreach, no waitlist campaigns. Just heads-down product work.
Here's what I got — and what it cost me.
What 6 weeks of building produced:
The product went from "data pipeline + free calculators" to a working dashboard with real intelligence behind it.
A Pulse dashboard with 5 KPI cards (revenue, return rate, AOV, customers, profit) that compare against your own historical baselines — same-day-of-week comparisons so Tuesday doesn't look like a bad Friday.
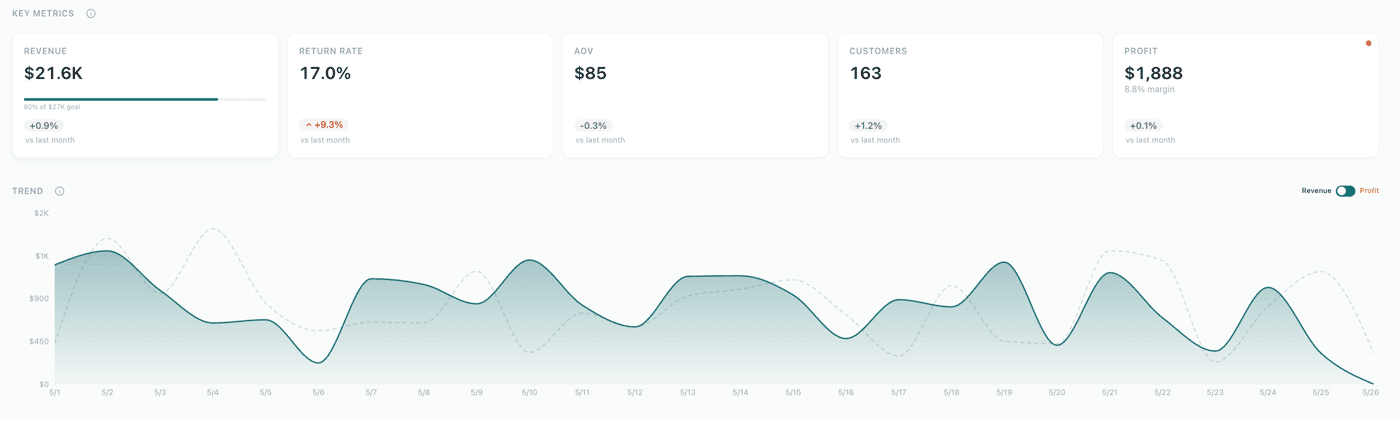
An AI brief reader that breaks store performance into sections — bottom line, what sold, what came back — with narratives explaining WHY numbers moved, not just charts. This was the core idea from milestone #1 and it actually works now.
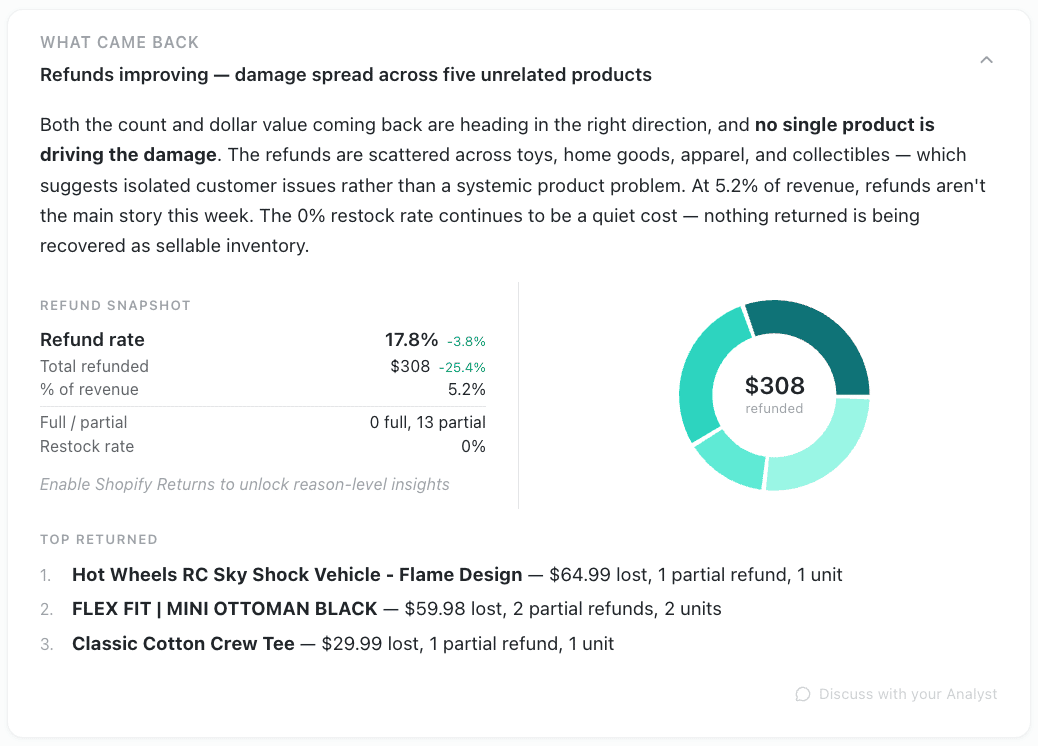
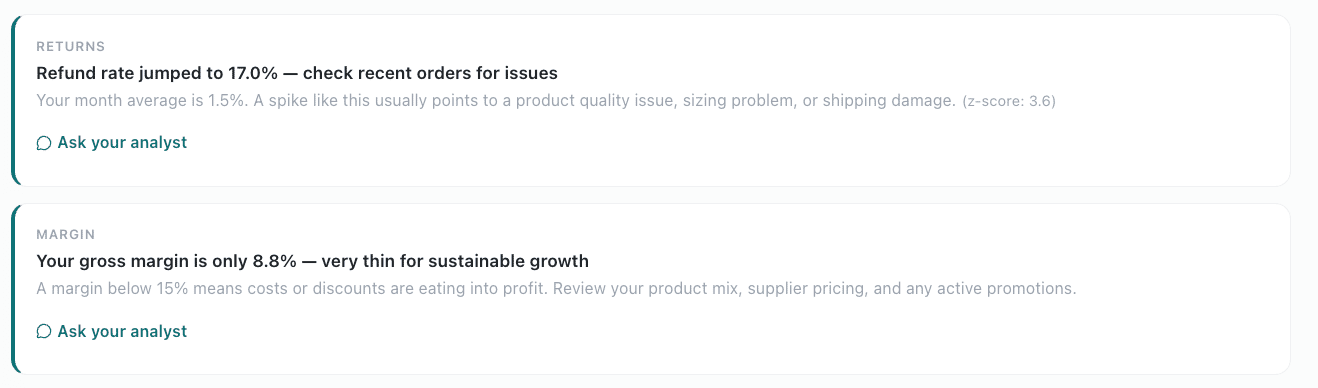
Anomaly detection that learns what "normal" looks like for each store and flags when something breaks pattern. One of the store owners I talked to early on described doing this manually with spreadsheets — comparing against 30-day rolling averages. I built that into the product with plain-English explanations instead of red numbers.
What 6 weeks of silence cost me:
My strongest beta candidate — a Shopify store owner who had engaged with me across multiple threads — went dark after I messaged them before the trip. No reply.
My last IH milestone got 1 like and 0 comments. I posted it the day before leaving and never engaged with anyone on it. Lesson learned.
Waitlist signups: zero. I deliberately held off on BetaList because I didn't want signups I couldn't follow up on for 6 weeks. Smart call, but it means I'm starting from nothing.
Community presence flatlined. The conversations I had are two months old now. Those people have moved on.
The uncomfortable part:
I validated the problem before I left. Store owners told me — independently, unprompted — that they check revenue every morning but don't actually know if it was a good day. The pain is real. But validation has a shelf life. Two months later, I have a much better product and essentially zero distribution. I'm starting over on that side.
What I'd tell other founders:
If you're going to go dark on distribution, make sure what you're building is demonstrably better when you come back. Screenshots, a working demo, something people can see. Because "I was building" without proof just sounds like "I was hiding."
I came back with a product I can actually show people. That's the only reason this tradeoff was worth it.
What's next:
Rebuilding community presence. Getting the product in front of real store owners this summer — aiming for a small group of beta users with connected Shopify stores. Still $0 MRR. Still solo. Still bootstrapped.
For founders who've gone dark mid-build: did you try to re-engage your old contacts when you came back, or just start fresh? Curious how others have handled this.

Almost every store owner I talked to checks revenue first thing in the morning. Almost every one also told me it's the wrong number to check.
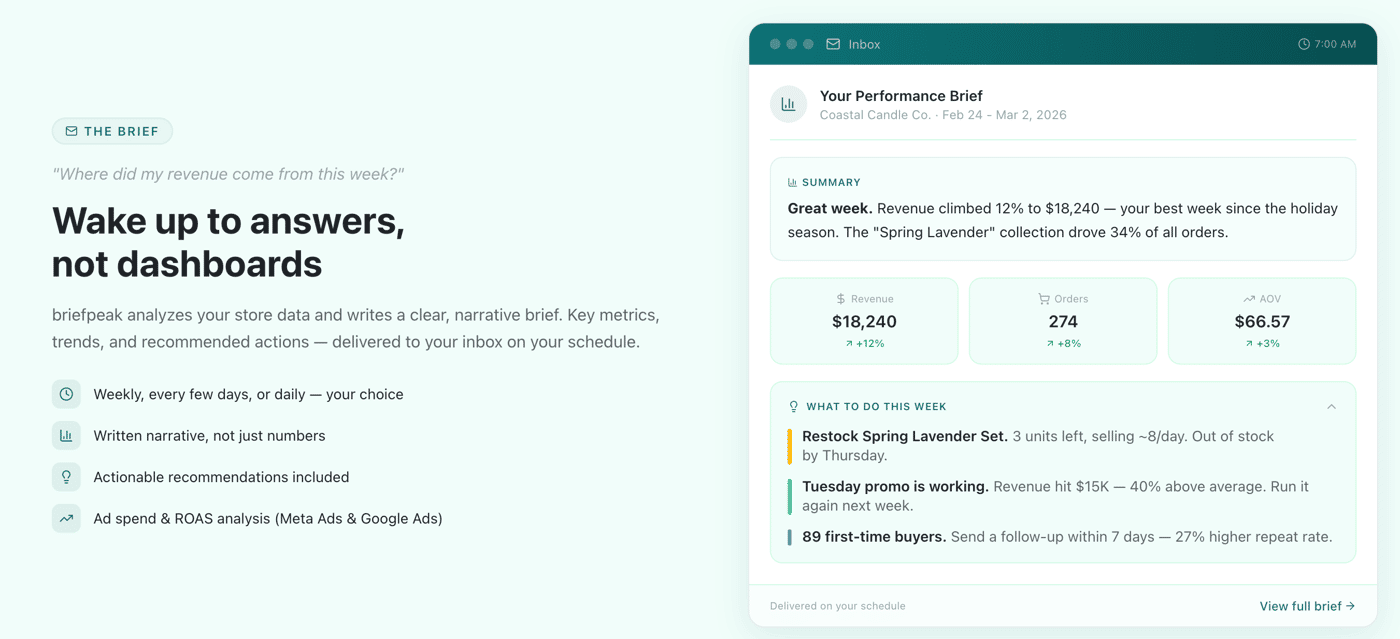
I'm building briefpeak — a tool that connects to your online store and sends you a morning email explaining what happened yesterday in plain English. I shared milestone #1 here a few weeks ago.
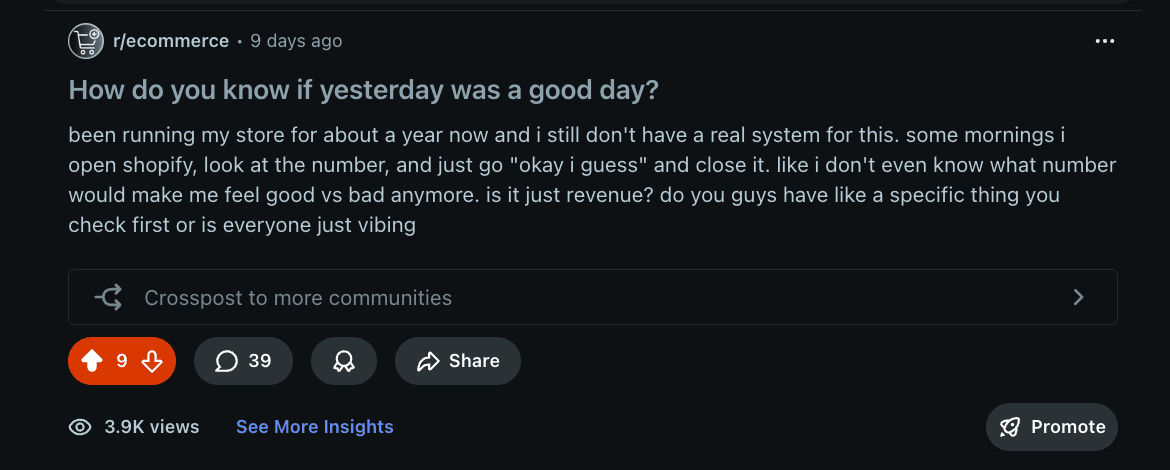
After 8 years of building analytics for e-commerce brands, I had strong opinions about what that email should say. But opinions aren't data — and a few of you in the comments challenged my assumptions. So I went to Reddit and put my thesis to the test with the simplest question I could think of: "how do you know if yesterday was a good day."
39 comments. 3,900 views. Some of it confirmed what I expected. Some of it changed the product.
1. I knew revenue was misleading — but I underestimated how much.
Almost every response started with "I check revenue." But then they immediately followed up with why that's misleading.
"Shopify dashboard just lies to you. Had an $8K day last Q4, felt like a massive win — pulled my spreadsheet next morning, Meta CPA had spiked to $65, actually lost $400." — store owner, daily spreadsheet tracker
"Revenue is a vanity metric dressed up as a KPI. The number you should be opening first is contribution margin per order." — experienced seller
One owner described setting a margin floor percentage and checking every morning whether it cleared or not. Pass/fail. That's it. No doom-scrolling dashboards.
2. Daily checking is a comfort habit, not analysis — this one I didn't expect.
I built the brief around the assumption that store owners actively use their morning dashboard check. Multiple people described the opposite: open dashboard, look at the number, feel good or bad, close it, change nothing.
"The daily revenue scrolling is just you pretending to work." — Shopify store owner (replied in two separate threads)
The store owners who broke out of this pattern all did the same thing — they picked ONE metric beyond revenue and tied it to ONE action. Add-to-cart vs checkout completed. Weekly rolling margin. Conversion rate against a baseline. The specific metric varied but the pattern was identical.
3. Returns as a daily signal — this one genuinely surprised me.
"Refunds and returns from the previous day tell you if those sales were clean or if problems are coming." — store owner who checks conversion rate, AOV, and support volume together
A spike in orders that creates a flood of support tickets the next day isn't actually a good day. It just looked like one. In 8 years of building analytics, I'd always treated returns as a monthly metric. This reframed it as a daily quality check — and it changed the product.
What this changed in the product:
When I wrote milestone #1, I thought I knew what the brief should say. I was partially right — but the thread pressure-tested my assumptions and changed several key decisions:
The daily email now leads with net revenue (not Shopify's inflated top-line number) compared against the same day of week, not just yesterday. A 4-year store owner pointed out he compares against the last 2 years of the same weekday — "Friday-Monday strongest, Tues-Thurs less." Without that, every Tuesday looks like a crisis.
There's now a "What Came Back" section that flags return activity as a next-day quality check on revenue — something I'd never thought to build before this thread.
The verdict cross-references margin, AOV, and order count to explain WHY a number moved, not just that it moved. And anomaly detection calibrates to each store's own baseline instead of arbitrary thresholds — confirmed by multiple owners who already do this manually.
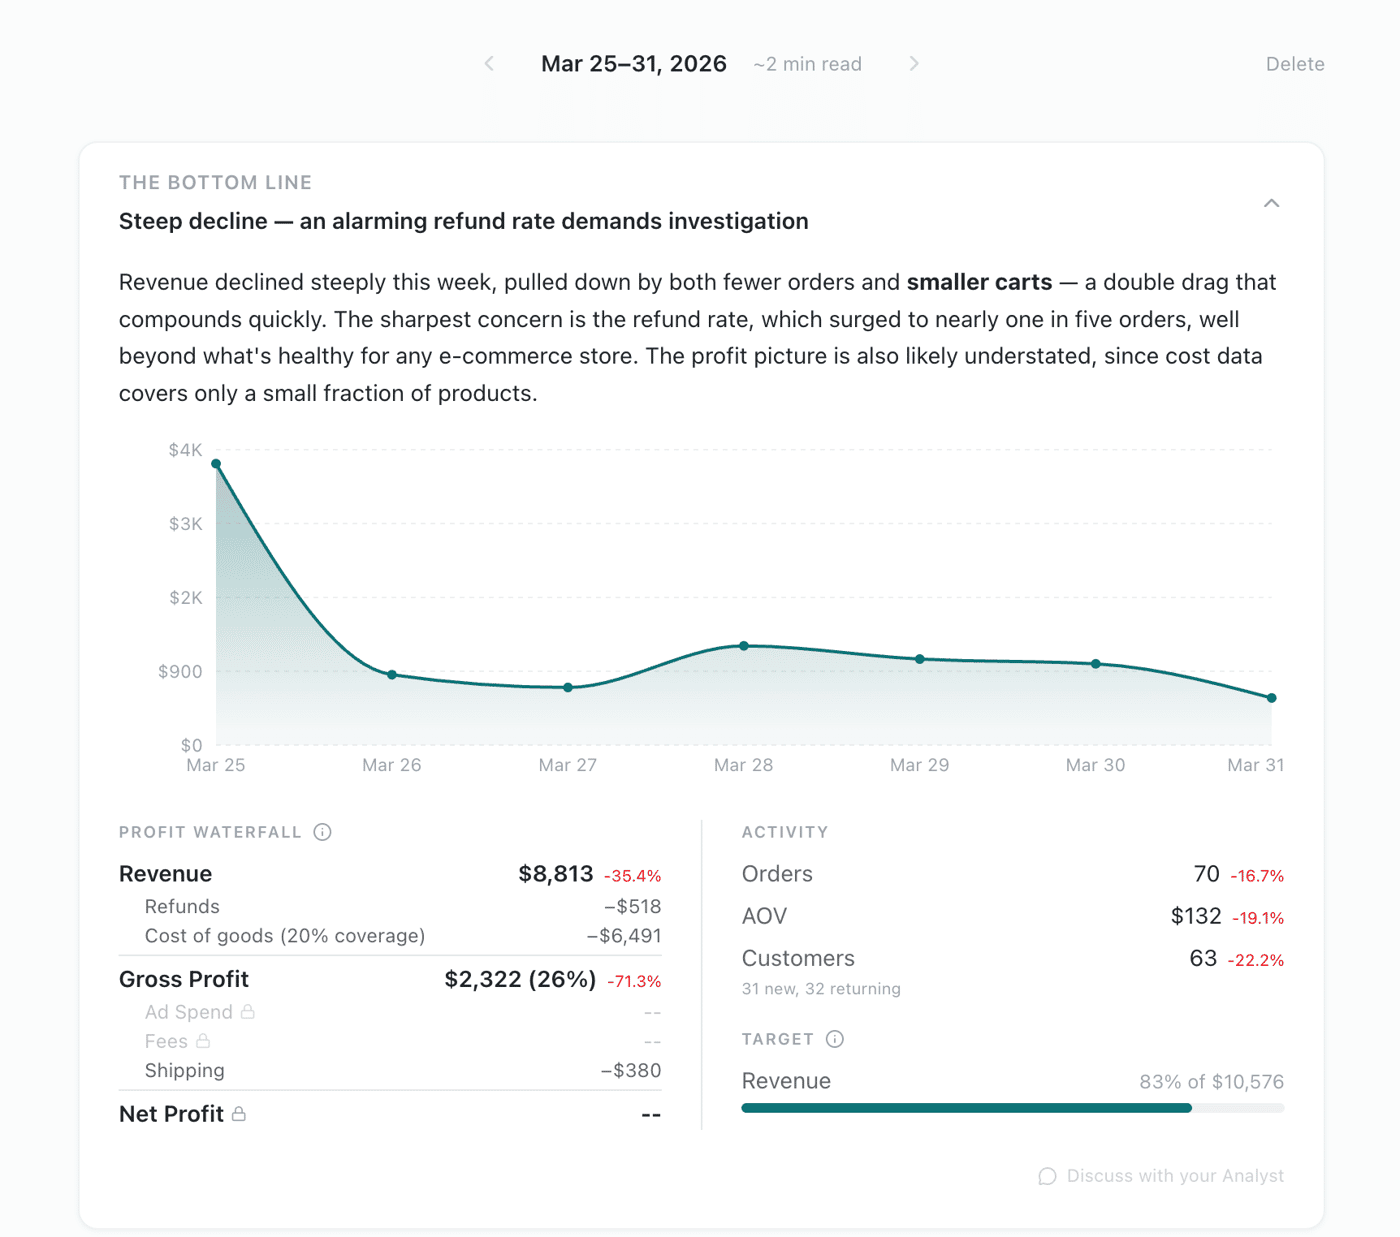
Still $0 MRR. Still solo. Still bootstrapped. The thing I'm testing next is whether email delivery actually changes behavior compared to a dashboard — or whether people ignore the email the same way they ignore dashboards.
The "one metric, one action, move on" pattern came up over and over from the most experienced owners. If you had to pick ONE thing you'd want a morning email to tell you about your business — not just the number, but what it means and what to do about it — what would it be?

For the last eight years, I've been building analytics systems for e-commerce companies. Dashboards, reports, data pipelines — the whole stack. I've worked with brands doing a few thousand a month and brands doing millions.
And the same thing kept coming up: store owners don't look at their dashboards.
They set them up, they pay for the tool, and then they check it once a week (maybe). Not because they don't care about their numbers — they absolutely do. But because most analytics tools are built for analysts, not for the person actually running the store. You open Shopify's analytics, see 47 different charts, and close the tab because you have orders to pack and ads to manage.
So I started building briefpeak.
The idea is simple: connect your store, and every morning you get an email that tells you what happened yesterday. Revenue, orders, returns, how your products are performing — written in plain English, not buried in charts. If something looks off (returns spiking, a product suddenly selling out, revenue dropping), you get a smart alert. No login, no dashboard, no chart-deciphering.
Where things stand right now:
Backend is built — Shopify OAuth, data sync, BigQuery pipeline, all working and validated against live store data
9 free calculator tools are live at briefpeak.com/tools (profit margin, break-even, LTV, ROAS, CAC, discount impact, conversion rate, store health scorecard, and a sample smart brief)
Waitlist is open for early access to the actual email briefs - invite you to join!
Revenue: $0. This is pre-launch. I haven't charged anyone for anything yet.
Solo founder, bootstrapped, based in Europe. No funding, no plans to raise.
What's next: I'm building the brief engine now — the part that actually takes raw store data and turns it into a readable morning email. After that, it's the alert system, then opening up to the first batch of waitlist users.
I'm starting with Shopify and will add WooCommerce, Stripe, and other platforms after that.
I'm curious — for those of you running online stores (or building tools for store owners): what's the one number you actually check every day? Not the one you think you should check — the one you actually pull up first thing in the morning. I want to make sure the briefs lead with whatever that is.
Happy to answer any questions about the build, the stack, or the approach.
-
2
This is fantastic. Having run a few ecommerce stores, including Shopify among others, this is exactly what is missing.
To answer your question directly: the first number I check is revenue from the last 24 hours. Not weekly, not monthly. Everyday. Everything else , I think, is context for that one number.
I think the morning brief concept is smart because it meets store owners where they actually are. Nobody is opening a dashboard before coffee. It's why I built KPILIO and I think An email that tells you what happened while you were sleeping and flags anything worth worrying about is how this should have always worked.
The returns spiking use case is the one that will resonate most with store owners. That one hurts quietly and usually shows up late. If your brief catches that early it will save people real money for sure.
Following this closely. Good luck with the brief engine. I Love it.
~Robert-
1
Robert, appreciate you sharing the specifics — "revenue from the last 24 hours, every day" is exactly the kind of signal I'm designing around. That daily heartbeat check before anything else really validates the brief format.
And yeah, the returns use case is one I keep coming back to. By the time most people notice it in a dashboard, the damage is already done. Early flagging there feels like the highest-impact win.
Interesting that you built KPILIO from a similar frustration. Would love to hear what you learned along the way. Following your work too.
-
1
In my day job. I always felt like I'm chasing the problem. In fact I'm chasing one right now haha. The biggest frustration, I think is having to dig out what happend, coming through loads of data just to find out it's a smart bot acting huma or campaigns got run youdidn't know where coming. I feel like that's the kind of blindsidedness I want to avoid. This is why I think yur product is needed too. When I wake up, tell me whats gong on with my business while I slept. PERFECT PERFECT PERFECT.
-
1
Robert, appreciate the energy here haha! That chasing the problem feeling is exactly what I kept running into too — spending the first hour of the day just figuring out what happened before you can even think about why.
Hope you catch whatever you're chasing right now :D Best of luck to you!-
1
Thank you and likewiase. I hope we meet at some developers conference some day.
-
-
-
-
-
1
Hi Dave!
8 years of e-commerce analytics experience and now own tool—this journey has been very inspiring!
When users start using Briefpeak, questions like "How do I connect my store?" and "How do I analyze sales data?" will be repeated a lot.
I'm building SupportBridge for exactly this problem—AI drafts safe replies from approved FAQs (max 1 reply, the team always approves).
If you'd like, I'll do a free audit of your last 100 emails and share the exact timeline + ROI.
Thoughts?
-
1
the "built for analysts not operators" framing is sharp. seeing the same thing in beauty products - people buy inventory trackers and expiry apps but dont open them because theyre designed like spreadsheets not like tools for someone whos actually using the products. the email-first approach sidesteps that entirely. curious if youve thought about how much context is too much in the daily brief before it starts feeling like another dashboard in disguise
-
2
Really appreciate that parallel with beauty product tools — the "designed like spreadsheets" problem is exactly it. People don't lack data, they lack something that meets them where they already are.
Your question about context overload is something I'm actively wrestling with. Right now my rule of thumb is: if it requires the reader to cross-reference something else to act on it, I've failed. One insight, one recommended action, minimal supporting context. But honestly I'm still calibrating.
What made you start thinking about this in the beauty space?
-
1
building an app that tracks beauty product expiry dates and inventory. same problem you described - most tools in this space feel like data entry chores rather than something that actually fits into how people use their products. trying to keep the focus on surfacing whats expiring soon and getting out of the way rather than making people manage a database
-
-
-
1
This resonates a lot.
I’m building a D2C fashion brand, and honestly, I’ve felt the same thing, dashboards look impressive, but they rarely change what I do day-to-day.The only numbers I actually care about are things like what’s selling today, what’s slowing down, and whether something needs immediate action.
Curious - when you tested this, what ended up being the one metric/store owners actually reacted to the most?
-
1
hey Rishav, would love to get your eyes on an early version when it's ready — is there a good way to reach you?
-
1
Honestly, the metric that got the most visceral reaction was sell-through velocity changes. Not just "this is selling well" but "this was selling well and just stopped." That shift from positive to negative momentum triggered immediate action almost every time. People would go check inventory, adjust ads, swap homepage placement — all within minutes of reading the brief.
Would love to hear how that maps to your fashion brand if you ever want to compare notes.
-
-
1
Eight years watching people not use dashboards is the exact right foundation for building something they will. The failure mode you described — set it up, pay for it, close the tab — happens because dashboards answer questions people aren't asking. A morning email that surfaces what changed and why meets people where they already are. To answer your question: from what I've seen talking to small store owners, the first number is usually revenue vs yesterday or revenue vs same day last week. The "vs yesterday" framing is more emotionally meaningful than any trailing average. Does the brief show that kind of comparison by default, or is it more absolute numbers?
-
1
Really appreciate the framing on "questions people aren't asking" — that's exactly the trap I watched teams fall into for years. Build the perfect dashboard, nobody opens it.
To your question: yeah, day-over-day comparison is the default view in the brief. Revenue vs yesterday, revenue vs same day last week. Both. You're right that the "vs yesterday" framing hits differently — it maps to how store owners actually think about their business. Trailing averages feel academic by comparison.
Curious what other numbers come up in your conversations with small store owners beyond revenue?
-
-
1
The insight: store owners don't ignore analytics because they're lazy. They ignore them because dashboards are built for analysts, not for people who pack orders. You're not building a better dashboard. You're building a signal that arrives when they're already in email. That's not a feature; that's respecting where their attention actually is.
-
1
Really interesting take.
From what I’ve seen, it’s not just that people don’t check dashboards — even when they do, it’s hard to connect numbers to what’s actually hurting revenue on the site. Curious how you plan to bridge that gap.-
1
That's exactly the gap I kept running into on the agency side. People would stare at a conversion rate drop and have no idea where to even start digging. The brief format is my attempt at solving that — each one ties a specific metric shift to a likely cause and a concrete next step, rather than just flagging that something changed.
Still iterating on how much context to include without making them overwhelming. Would love to hear what kinds of signals you've found hardest to make actionable.
-
1
From what I’ve seen, the hardest part is going from “conversion dropped” to understanding what actually changed on the site — especially when it’s something small but impactful.
Your approach of tying metrics to likely causes makes a lot of sense.
Curious how you arrived at that — was it mostly from patterns you kept seeing with clients, or did anything specific push you in that direction?-
1
Mostly patterns from clients. The same 5-6 root causes kept showing up: someone changed a price without telling anyone, a discount code broke, a top-selling product went out of stock, shipping times crept up, a campaign started driving traffic to the wrong landing page, etc.. Once you've seen those enough times, you can map most metric shifts to a short list of likely causes and check them automatically. At least I hope you can haha!
The "small but impactful" ones are the hardest — like a single SKU going out of stock that was driving 20% of conversion. That's the stuff dashboards will never surface.
-
1
Yeah, that makes a lot of sense — those are exactly the kind of issues that are obvious in hindsight but easy to miss in the moment.
The SKU example is a good one, I’ve seen similar cases where one small change quietly impacts a big part of revenue.
Interesting that these patterns repeat so consistently — feels like most of the value is in surfacing them quickly rather than analyzing more data.
-
-
-
-
-
0
Serving ecommerce brands to building your own gives you a massive unfair advantage. You've seen what metrics actually matter across thousands of stores. Are you building on a specific platform or going custom?


Comment